Measuring UX Like a Pro
UX METRICS





Great UX is not a lucky guess - it is a science backed by numbers. Here are 6 powerful metrics every designer and product team should track.
Great UX is not a lucky guess - it is a science backed by numbers. Tracking the right metrics tells you exactly where users struggle, where they succeed, and whether your design decisions are actually working.
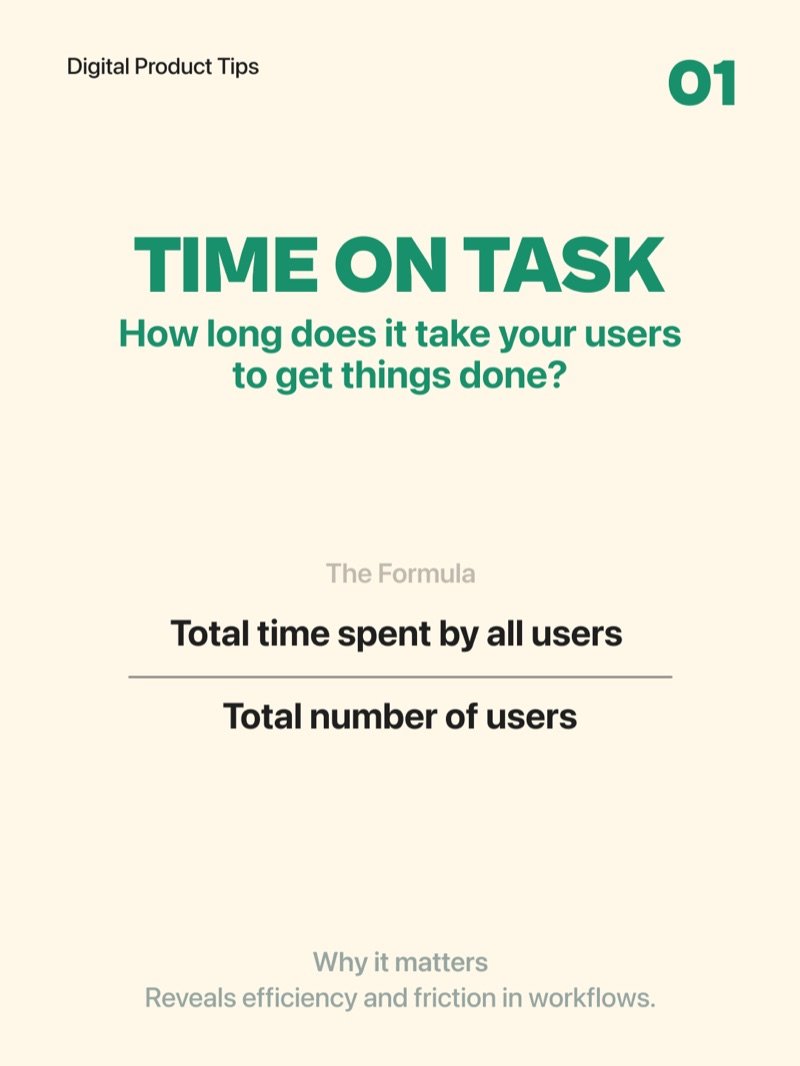
Time on Task
How long does it take your users to get things done? Divide total time spent by all users by the total number of users. A lower average means less friction. This metric reveals efficiency problems and workflow bottlenecks before they become bigger issues.
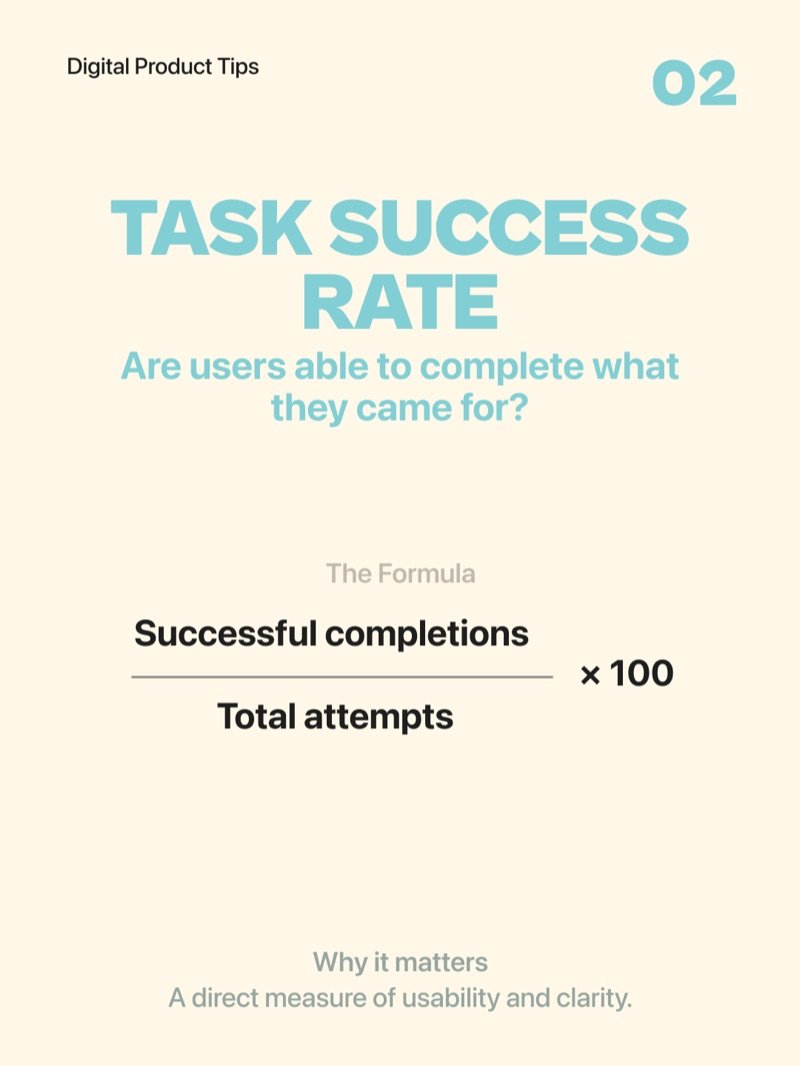
Task Success Rate
Are users able to complete what they came for? Divide successful completions by total attempts and multiply by 100. This is a direct measure of usability and clarity - if people cannot finish the task, something in the design is breaking down.
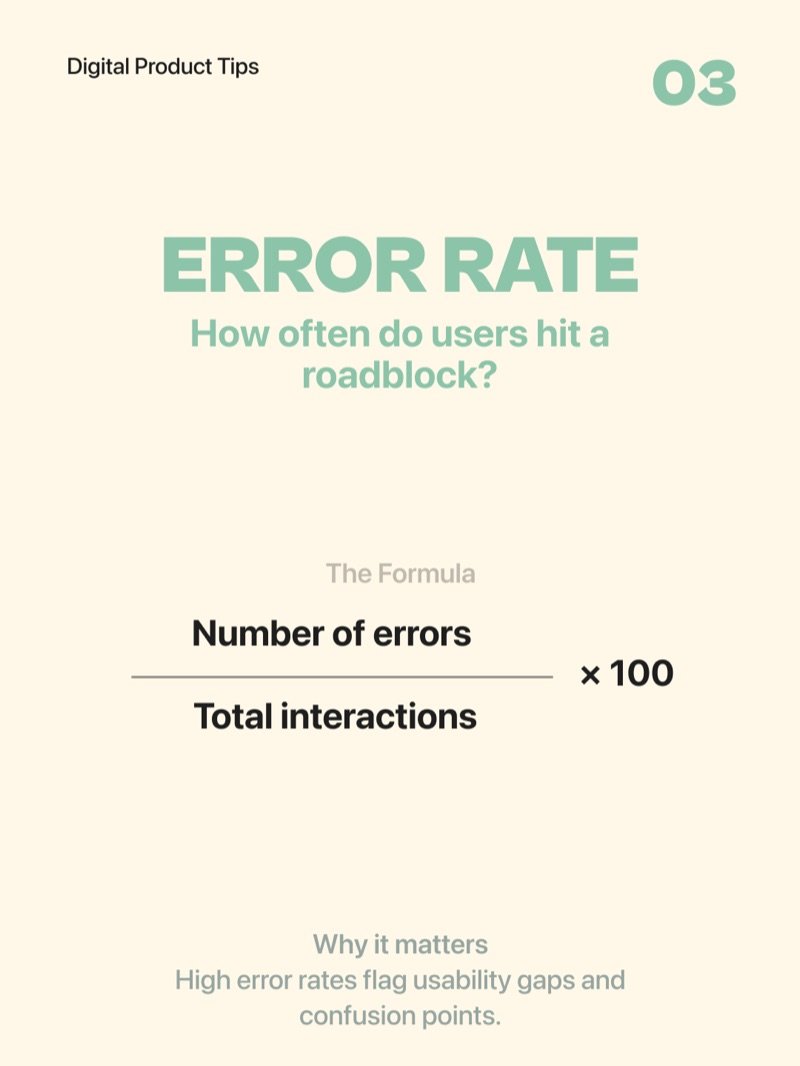
Error Rate
How often do users hit a roadblock? Divide number of errors by total interactions and multiply by 100. High error rates flag usability gaps and confusion points. They tell you where to focus your next iteration.
Net Promoter Score
Would your users recommend you? Ask them to rate on a scale of 0 to 10. Promoters score 9 to 10, Passives 7 to 8, and Detractors 0 to 6. NPS gauges loyalty and overall satisfaction - the kind of signal that predicts long-term product health.
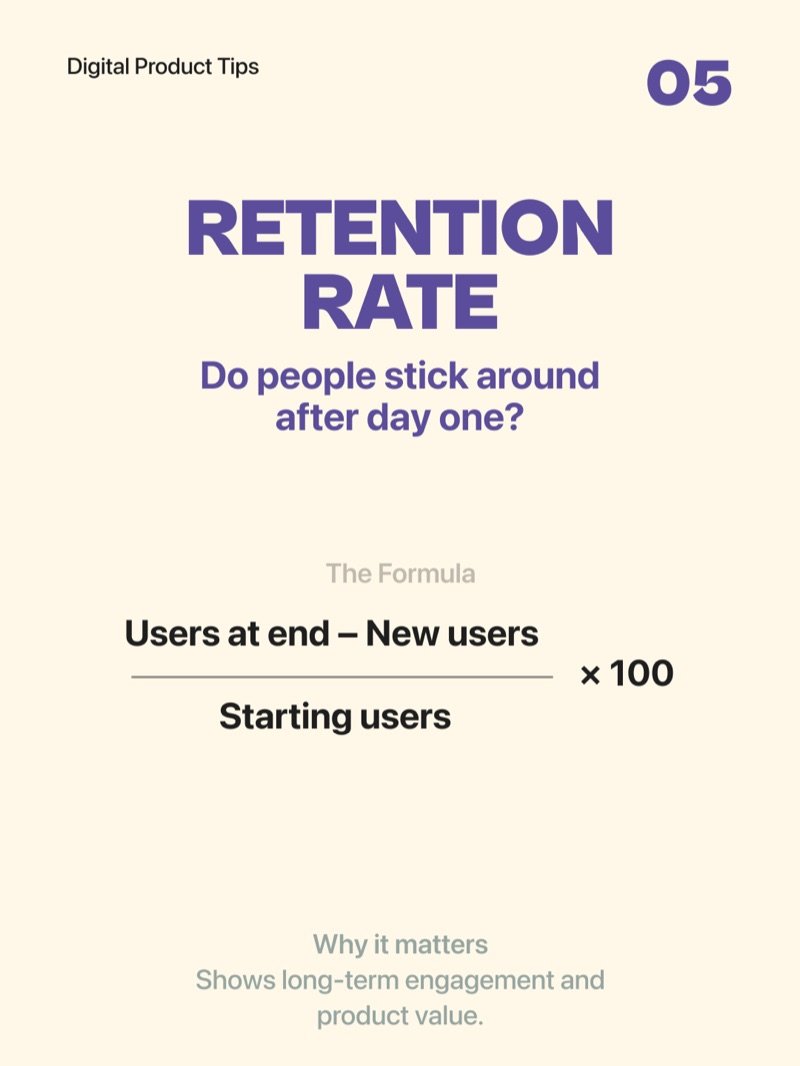
Retention Rate
Do people stick around after day one? Subtract new users from users at end of period, divide by starting users, multiply by 100. Retention shows long-term engagement and product value. Acquisition gets users in - retention proves the product earns them.
Conversion Rate
How many visitors take the action you want? Divide users who acted by total visitors and multiply by 100. This is the ultimate sign your design is driving real results - not just looking good, but actually moving the needle.